MaPagenda

Optimisation, organisation, rentability

Author: ozett

Travel by postal code

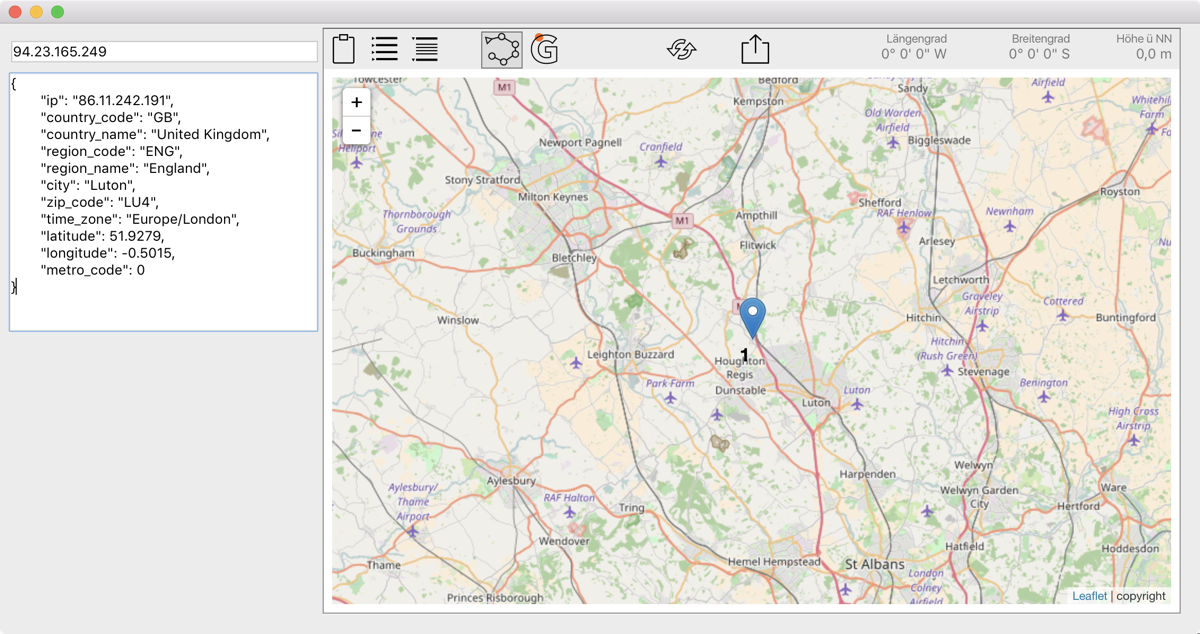
As long as there is nothing better, we organise the travelling people by ZIP-code. In Germany the first 2 numbers are easy to use and work well, dividing the country into some 100 regions.

If your salespeople are more local, the zip-code is of no use anymore. People who know their region well, organise their routes without really thinking about. Does someone in the office the appointments, I better rely on technical help.

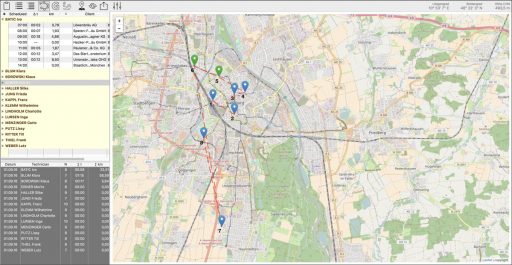
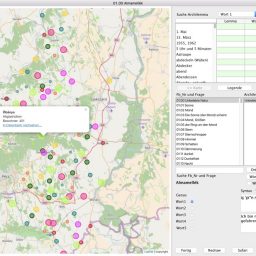
This is a tour crossing Augsburg, Bavaria.

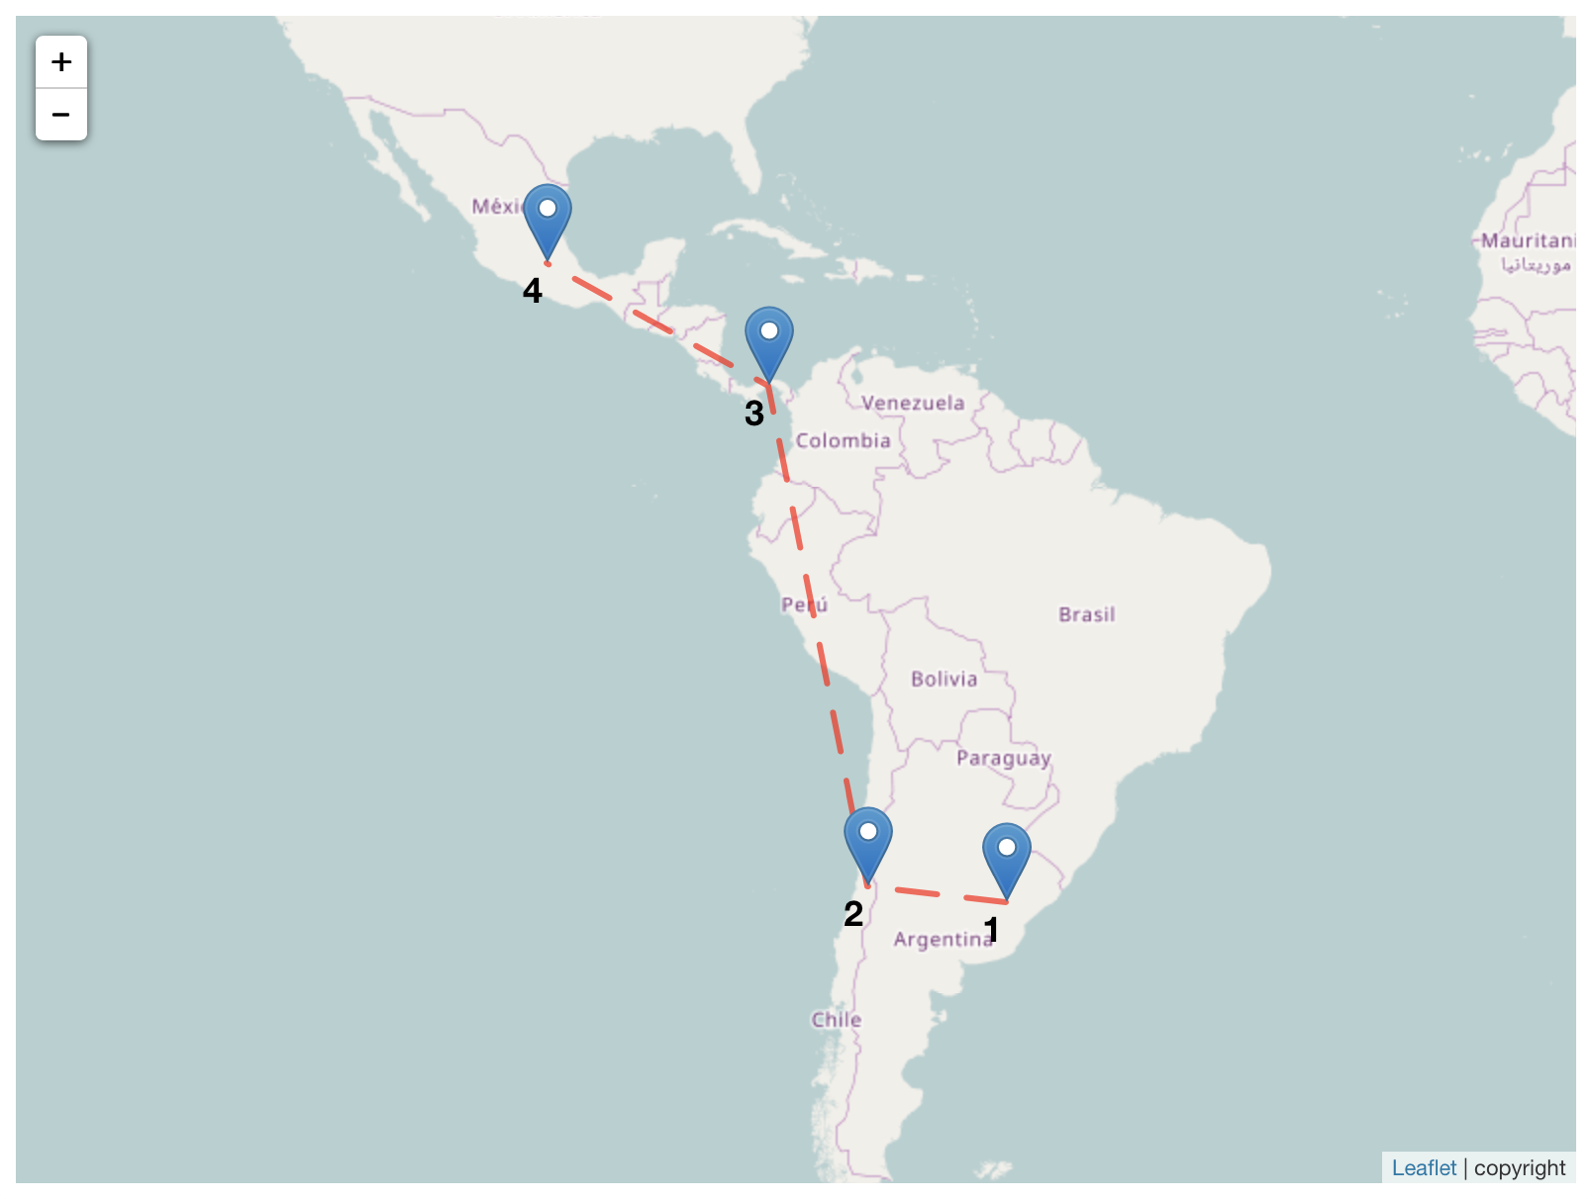
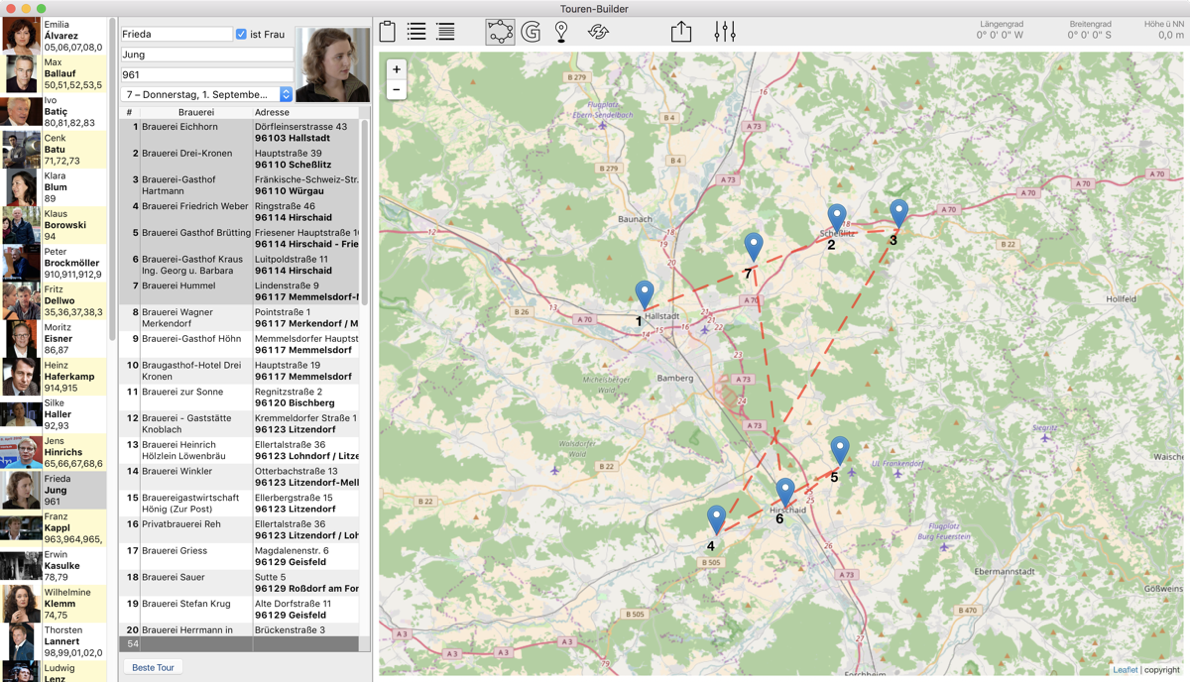
Here a different region. Obviously not the best route, when sortet by zip and alphabet,

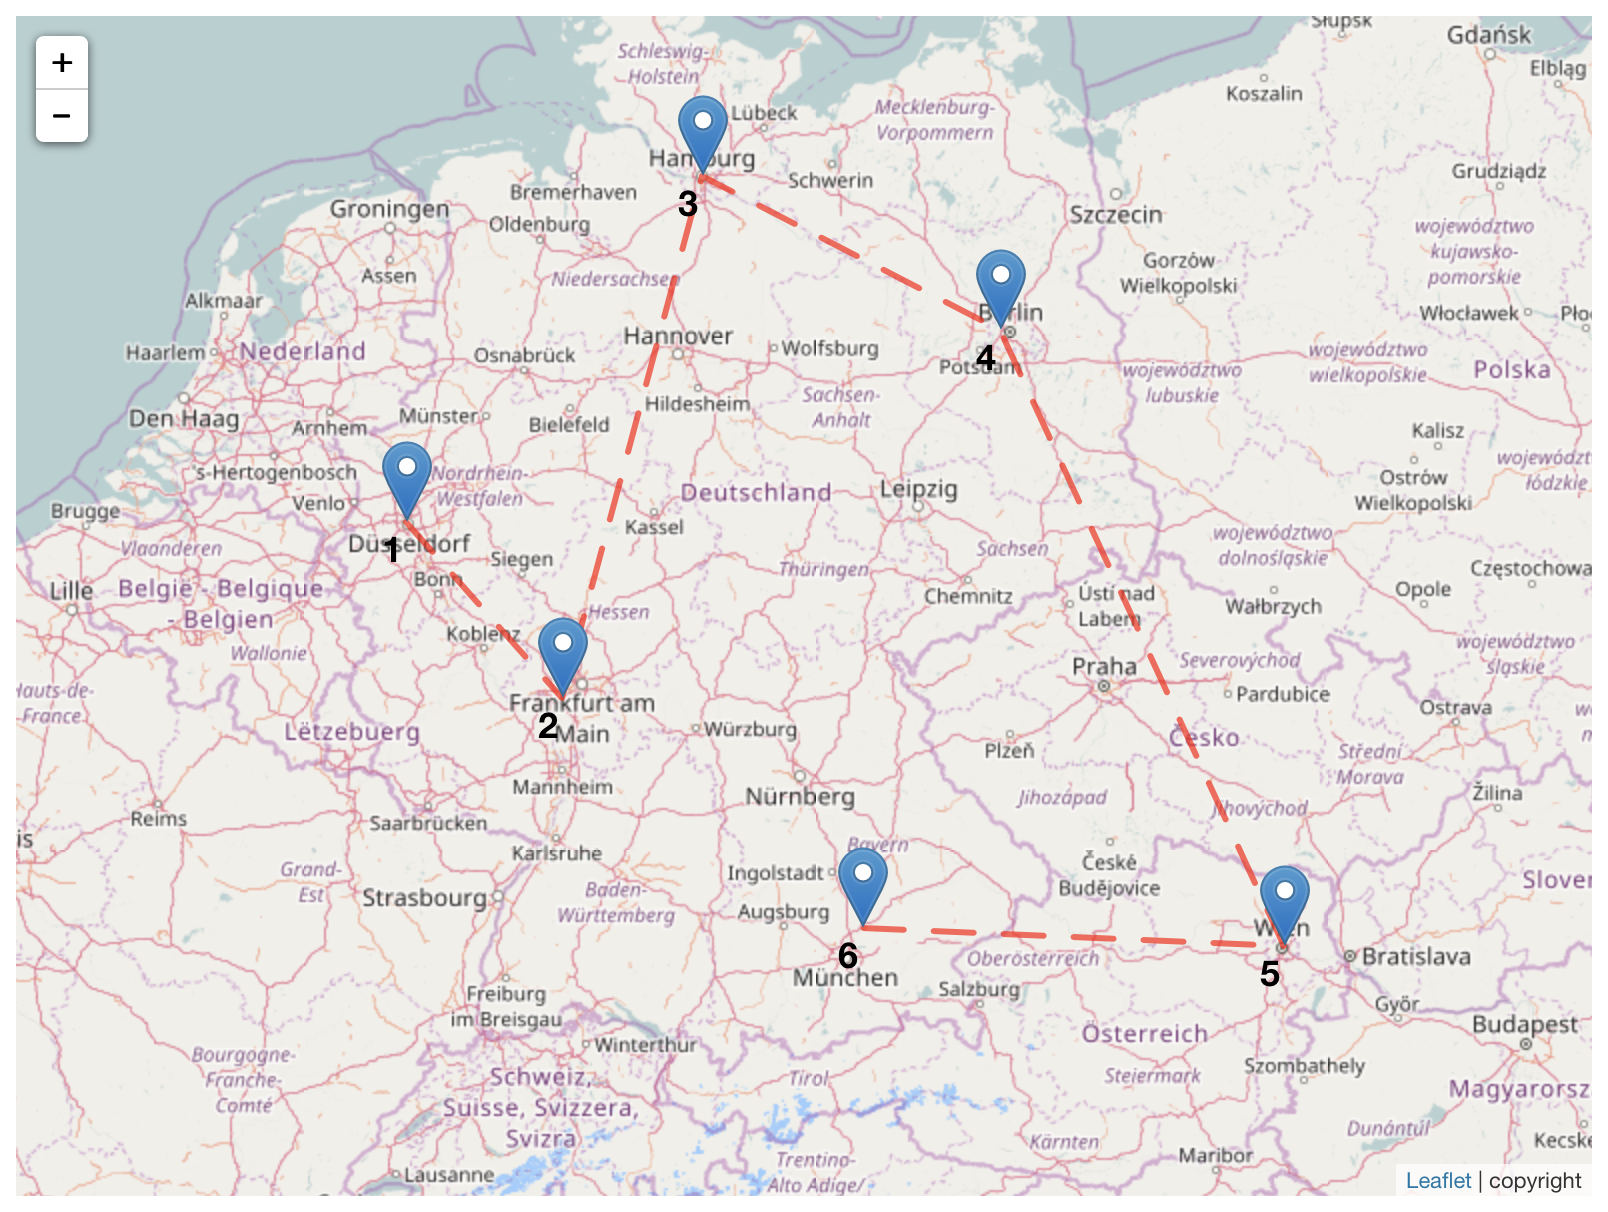
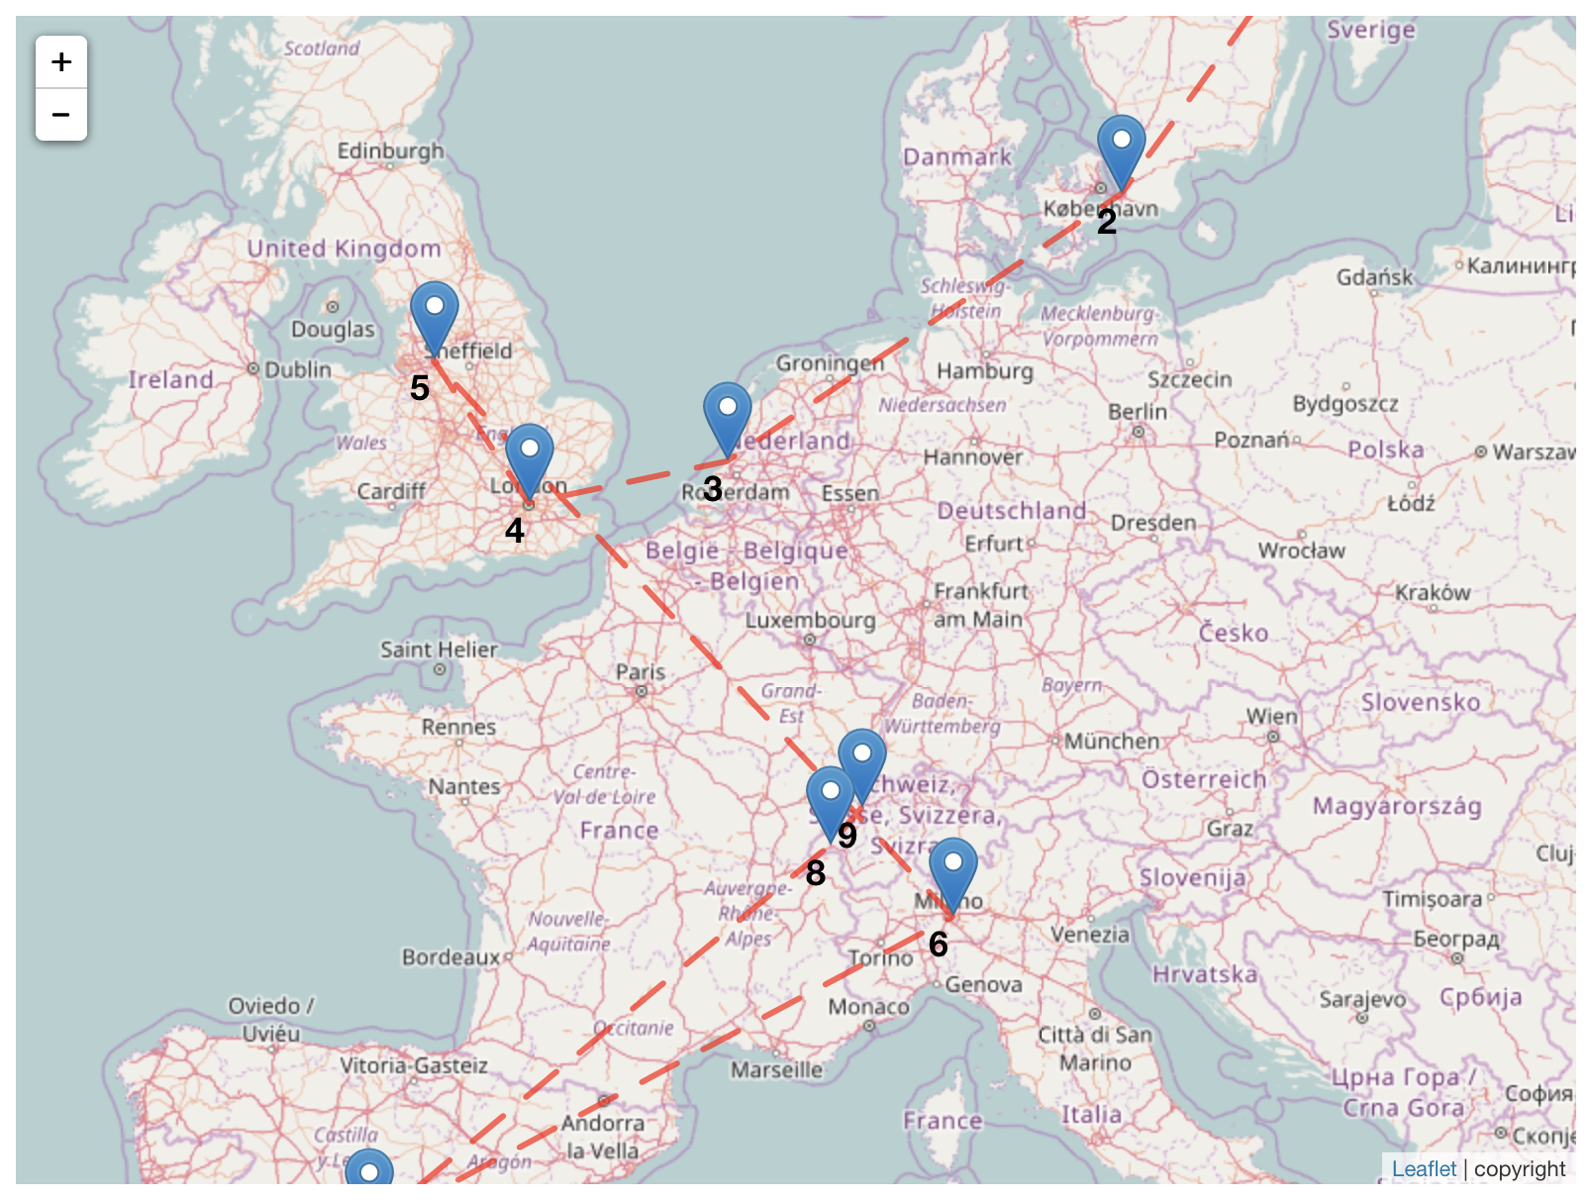
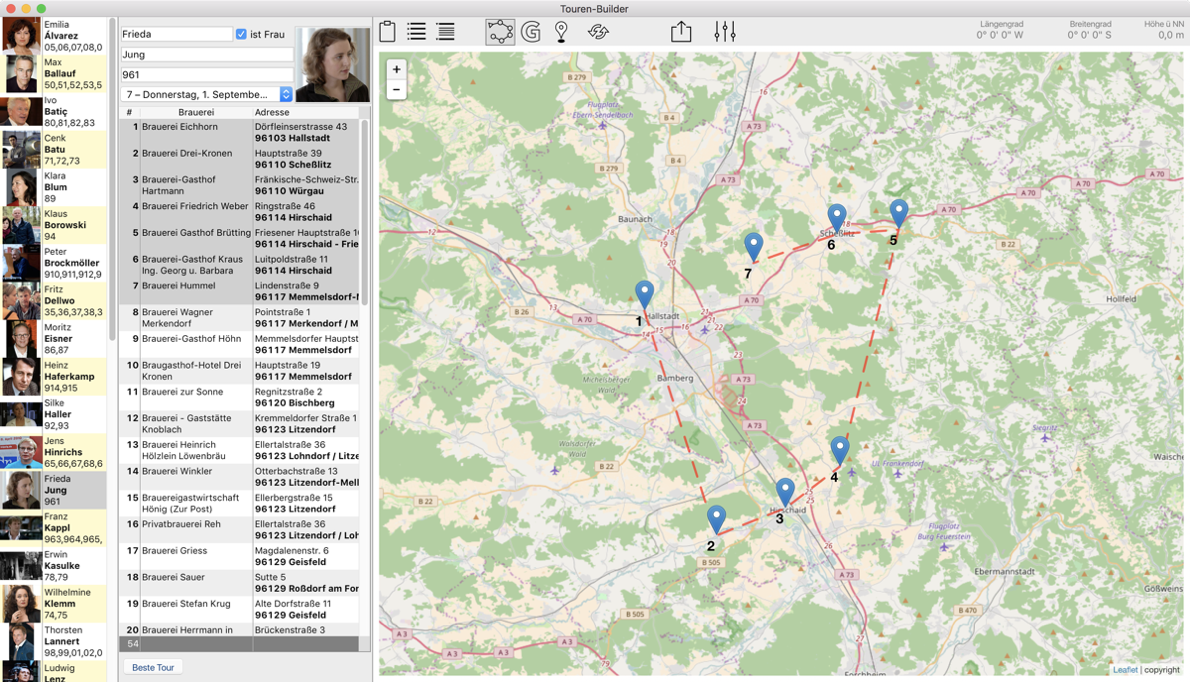
This is the same selection optimised for shortest distances:

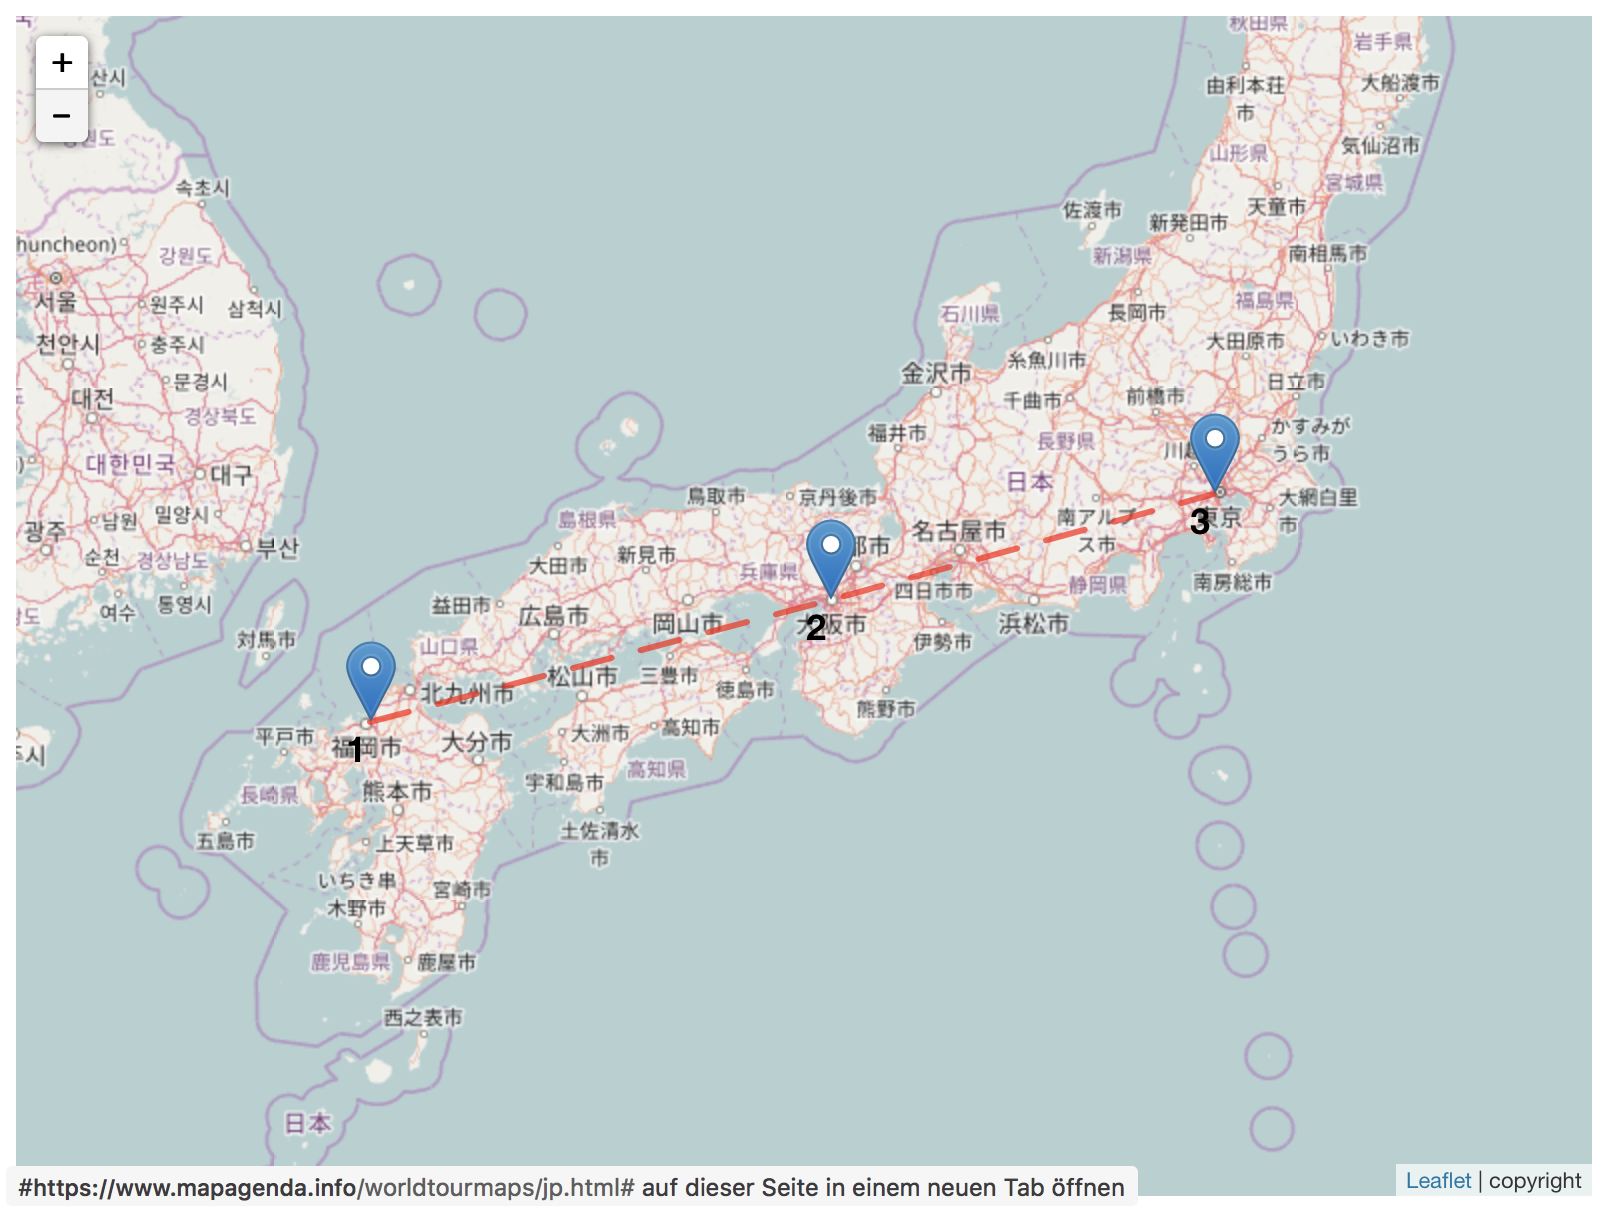
And this shows the same travel on real roads:


My map is different

Some 4D-applications are very specific. A linguistic-professor asked, to show the german dialects of southern Hungaria (schwäbische Türkei) on a map und being able to dig deeper from the map. His map is different.

He solved the problem with MaPagenda, plugged into his 4D-app with some help from us.

German dialects in southern Hungaria

The accompanying sound-documents will be played, when a marker on the map is clicked. Like “let me hear Wenker-sentence 23″.

Any time soon, public mills grind slowly, this database will be published on the net. Today it’s just a button-click away to open the map in a browser.

[Follow-Up] map of more IPs

This is a follow-up to Where is this IP from? There I explained how to find where a IP came from. Now the question is, where did the IPs of today come from. The answer is a couple lines of code

  • select the IPs
  • define the object-structure als template
  • set the selection to json and assign to the MaPagenda-subform

Draw more than one IP onto a map

The map is just another kind of display for data:

locations of many IPs drawn on the map

This map shows to much information. I need to dissect, subselect, analyse and understand what I’m seeing here. The very first enhancements will lead to a map like this:

different marker-colors

Where is this IP from?

I was parsing log-files from a webserver. Main interest are which IPs surfed to the site and where did they come from. I used the service of FreeGeoIP for the information.

Row 15 shows the request to FreeGeoIP. I want the result as JSON-object, why I send an object for the response. Did the request succeed (status = 200), I do read the coordinates from the Response_O and use MaPagenda-keywords to fill the mapObject. Finally the mapObject is converted into a JSON-string and delivered to the subform-variable.

this is the code

And this is how the results look like: the response_O and the map.

MaPagenda shows where

4D World Tour 2017 Maps

Where does the 4D World Tour 2017 host events? I’d like to see that on a map and read the sequence of events at a glance.

We had to first extract the data from the 4D-Website. Then, because website-data is hardly properly organised for a database, put them into a Numbers-spreadsheet and did some enhancements. Enhancing means putting addresses into separate columns, name the columns according to keywords, add empty columns for latitude and longitude, add a second table for the teams and reference that data into the first table.

Exporting from Numbers does not support JSON, so we used CSV. Then run through MaPagenda to convert CSV into JSON. Finally the JSON opend in MaPagenda and created the maps. Those maps are included in this page by iframes.

MaPagenda learned new tricks while building these maps.

Click a map-picture to open the interactive map in a new window. Select a marker and read hotel, city, date and team.

USA

Australia and New Zealand

Australien und Neuseeland

South America

Germany and Austria

France

Every marker is numbered and crossing pathes maybe an optimization of the tour

Europe besides DE, AT and FR

Japan

Powered by WordPress & Theme by Anders Norén